
Fig. 3.
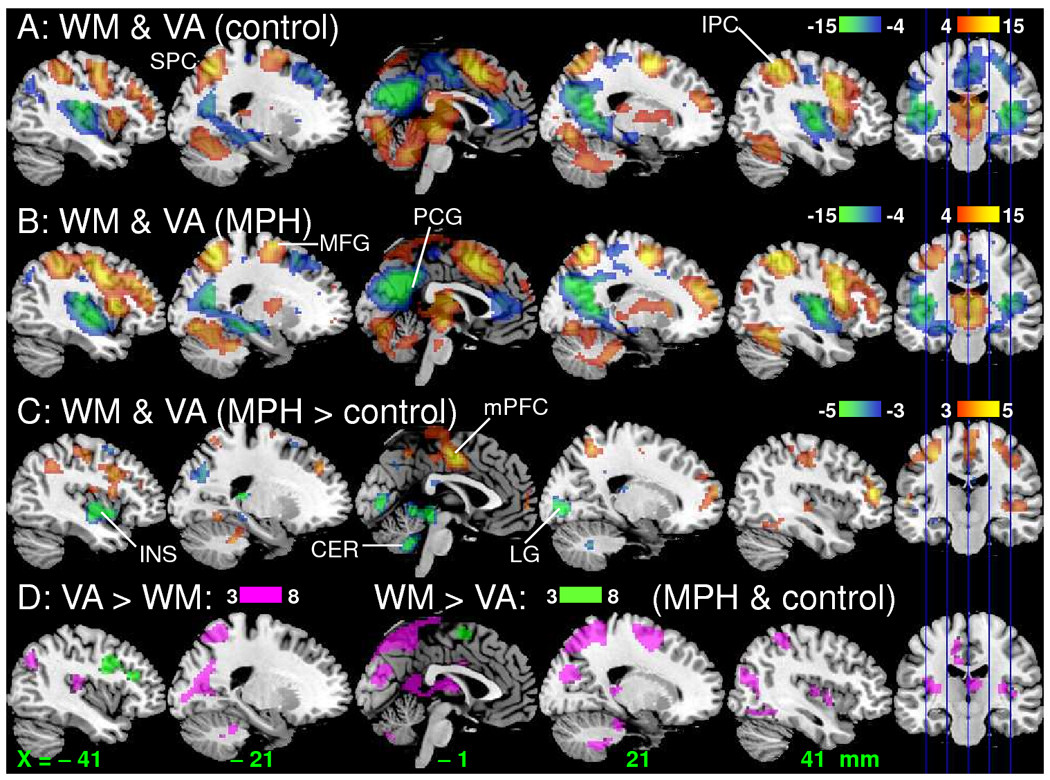
Brain activation patterns rendered to a structural MRI image. Statistical maps (t-value) of BOLD-fMRI responses during the WM and VA tasks (ANOVA model1) for the control (A) and MPH (B) groups as well as for the differential signal between the groups (C) (ANOVA; red-yellow: activation; blue-green deactivation), and between the tasks (D; ANOVA model1). WM sample: 16 MPH and 16 control healthy subjects. VA sample: 15 MPH and 14 control subjects. MFG: middle frontal gyrus; mPFC: medial prefrontal cortex; IPC: inferior parietal cortex; SPC superior parietal cortex; LG: lingual gyrus; PCG: posterior cingulate gyrus; INS: insula; CER: cerebellum.