
Fig. 6.
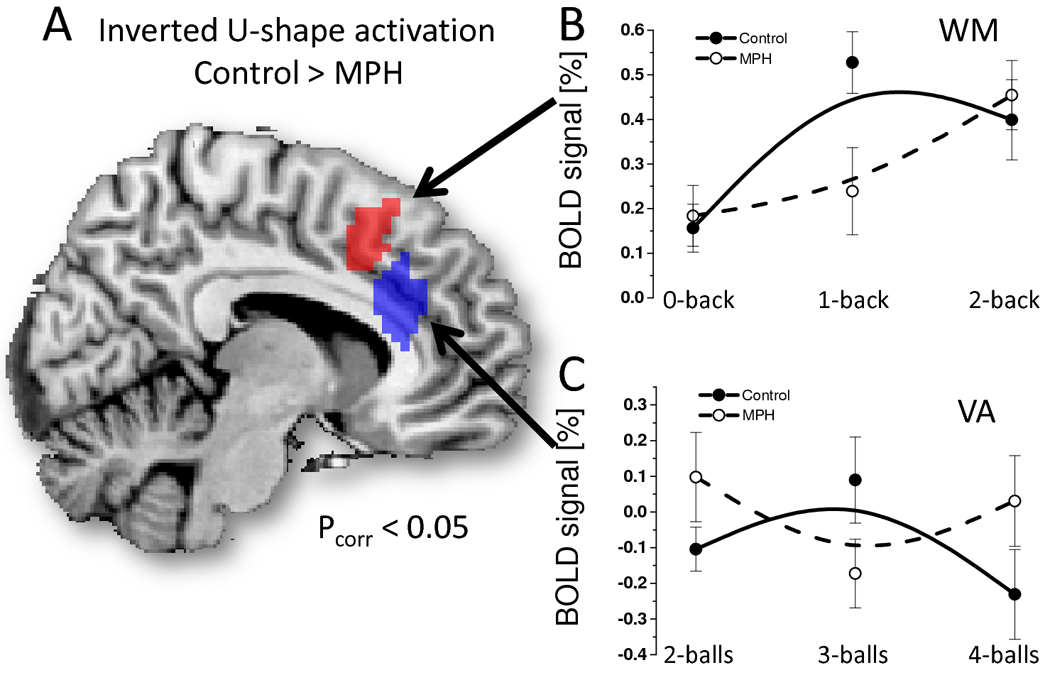
Brain regions exhibiting statistically significant effects of MPH on non-linear BOLD responses (inverted U-shape as a function of cognitive load increases) during WM (red) and VA (blue), superimposed on a sagital view of the human brain (A) and scatter plots showing the %BOLD signal for each cognitive level, group (control: solid circles; MPH: open circles) and task (B: WM; C: VA); ROI analysis. B-spline solid and dashed lines are also shown as guide lines.