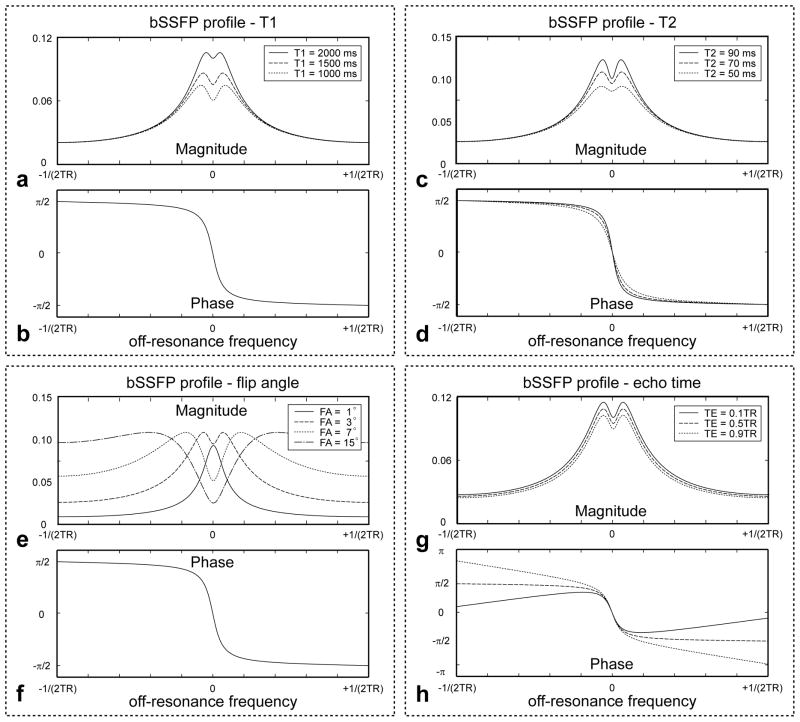
Figure 2.
Balanced SSFP magnetization profiles for multiple T1 (a and b), T2 (c and d), flip angle (e and f) and TE (g and h) values. The default values for the simulation were TR = 10 ms, TE = 5 ms, flip angle = 3°, T1 = 1500 ms, T2 = 70 ms, and off-resonance frequency = −50 Hz to 50 Hz. Despite large changes in the shape of the magnitude profile, the phase transition near the resonance frequency is only affected by T2 values. A long T2 induces sharper phase transition whereas a short T2 reduces the phase slope. This phase transition variation generates additional frequency contrast when T2 values are significantly different. For example, clear delineation of gray matter and CSF boundary is observed in bSSFP phase images compared to GRE phase images (Fig. 4, 5 and 7).

