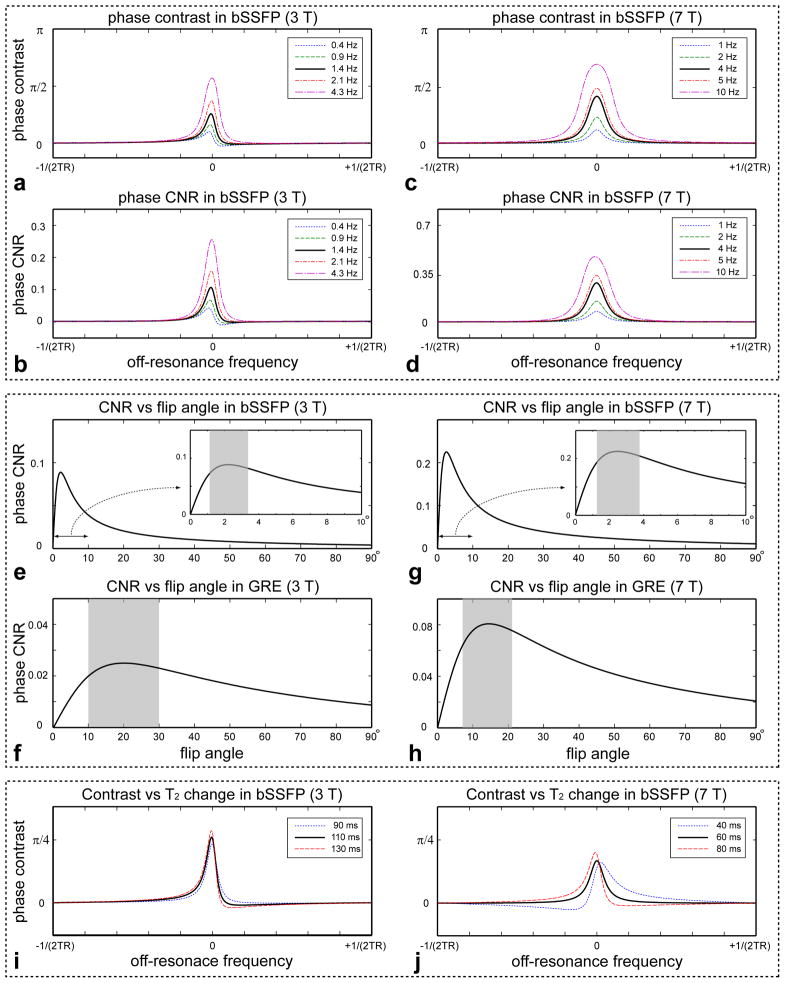
Figure 3.
Simulations results. (a–d) Balanced SSFP phase contrast at 3 T (a) and 7 T (c) and phase CNR at 3 T (b) and at 7 T (d) over a 1/TR frequency range for various resonance frequency shifts. The solid black line represents the results of the gray and white matter frequency contrasts (1.4 Hz at 3 T and 4 Hz at 7 T). (e–h) Phase CNR dependence on a RF flip angle in bSSFP at 3 T (e), bSSFP at 7 T (g), GRE at 3 T (f), and GRE at 7 T (h). The inset plots show a zoomed range between 0° and 10°. The shaded areas represent 50% flip angle variation ranges from the optimum flip angles. (i and j) Phase contrast for multiple gray matter T2 values. For white matter, the default T2 value (80 ms at 3 T and 60 ms at 7 T) was used.

