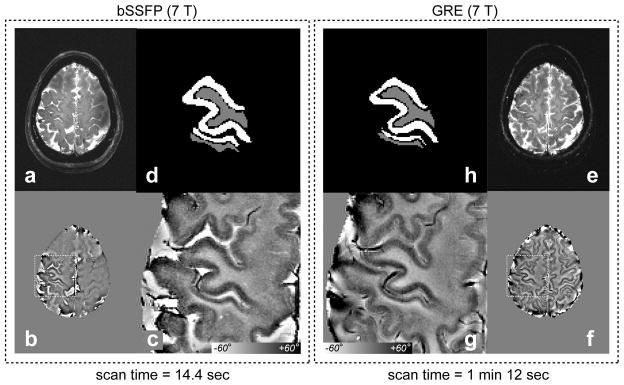
Figure 5.
Comparison of bSSFP and GRE images at 7 Tesla. (a) bSSFP magnitude image. (b) bSSFP phase image. The contrast exists in limited areas due to B0 and B1 inhomogeneities. (c) bSSFP phase image zoomed in the dotted rectangle area in (b). (d) bSSFP ROIs (white for white matter and gray for gray matter) for quantification. (e–h) GRE equivalents of (a–d). The CNR of the phase image is lower in the bSSFP image compared to GRE. However, when corrected for difference in scan time (14.4 sec for bSSFP and 1 min 12 sec for GRE), the CNR efficiency of bSSFP is 1.71 ± 0.11 (when averaged in all subjects) higher than that of GRE.

