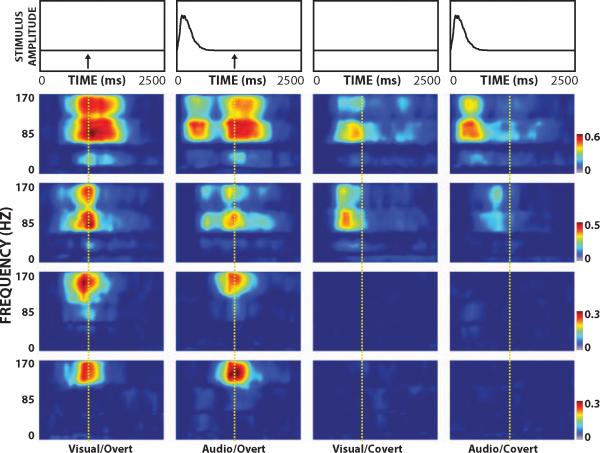
Figure 3.
Example of r2 time-frequency distribution for the indicated experimental condition (bottom) and temporal envelope of the auditory stimulus (top). Arrows mark the onset of the subject's response. Figures from top to bottom correspond to results from channel 30, 40, 53 and 55, respectively. Signals at different times, locations, and frequencies and for different experimental conditions relate to different aspects of the stimulus or response. The vertical dashed line indicates the onset of the verbal response during overt speech.

