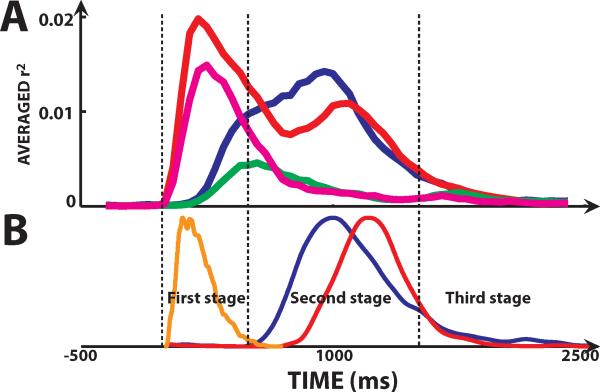
Figure 8.
Activation time course. A: Averaged time course of r2 computed for all electrodes from all left-hemisphere subjects during each of the four different tasks. Blue and red traces correspond to responses for overt speech following visual and auditory stimuli, respectively; green and purple traces correspond to responses for covert speech following visual and auditory stimuli, respectively. B: Averaged temporal envelope of auditory stimuli (orange trace) and verbal responses following visual (blue trace) and auditory (red trace) stimuli, respectively.

