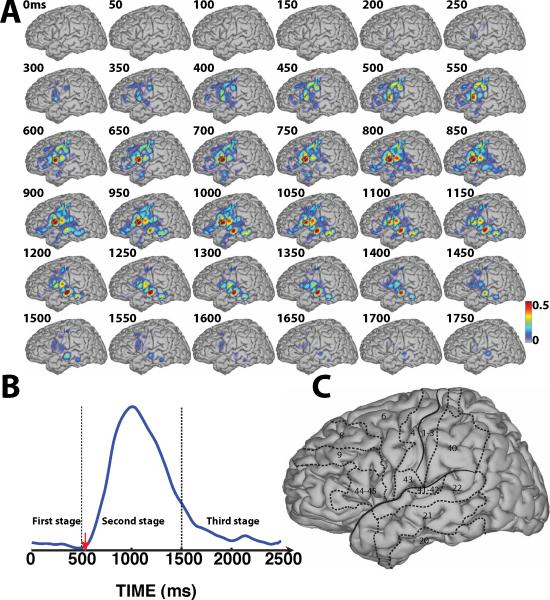
Figure 9.
Comparison between overt and covert speech following visual stimuli. A: Color-coded r2 values superimposed across all subjects that participated in both the overt and covert speech tasks (i.e., A, B, E, F, G, I). B: Averaged temporal envelope for verbal response (blue trace), and onset of the verbal response (red arrow). C: Outline of the approximate location of relevant Brodmann areas.

