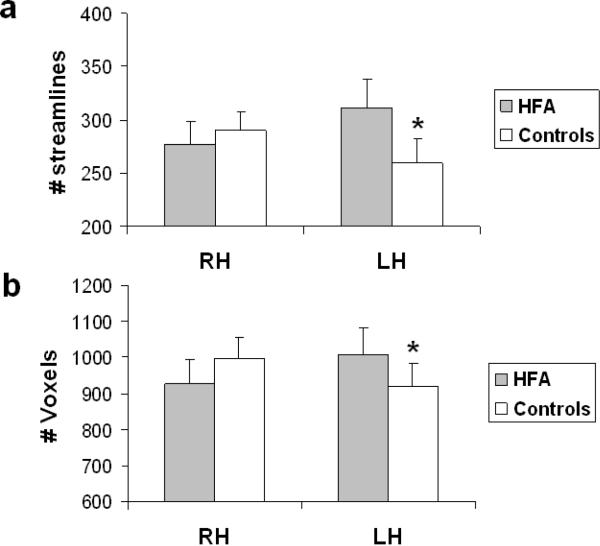
Figure 3.
(a) Number of streamlines and (b) number of voxels through which the streamlines project collapsed across the 3 intra-hemispheric tracts in the right and left hemisphere for the HFA and control groups. In both cases, compared to the control group, the HFA group shows a significant increase in structural connectivity in the left hemisphere. Error bars indicate standard error of the mean. * p < 0.05.

