Figure 2.
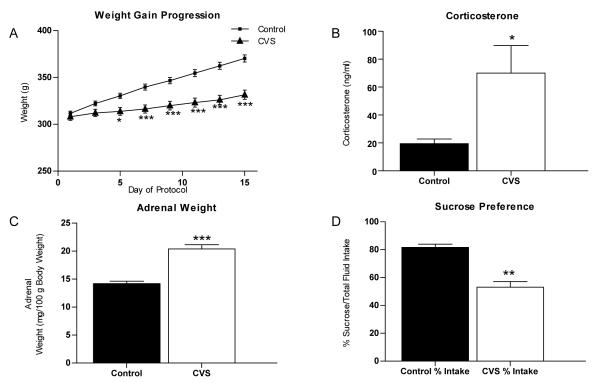
Physiological measures of chronic stress. Quantification of physical parameters from animals subjected to either control conditions or 14 days of chronic variable stress (CVS). (A) CVS results in a significant decrease in weight gain (n=12) compared to control (n=12). (B) Serum levels of corticosterone from trunk blood are increased in CVS animals compared to control animals (n=9). (C) A significant increase in adrenal weight relative to body weight was seen in CVS animals compared to control animals (measured as mg/100g body weight; n=12). (D) A reduction in sucrose preference was observed following CVS (measured as % sucrose intake/total fluid intake; n=6). Data are shown as means ± SE; *P<0.05 vs. control; **P<0.01 vs. control; ***P<0.0001 vs. control.

