
Fig. 3.
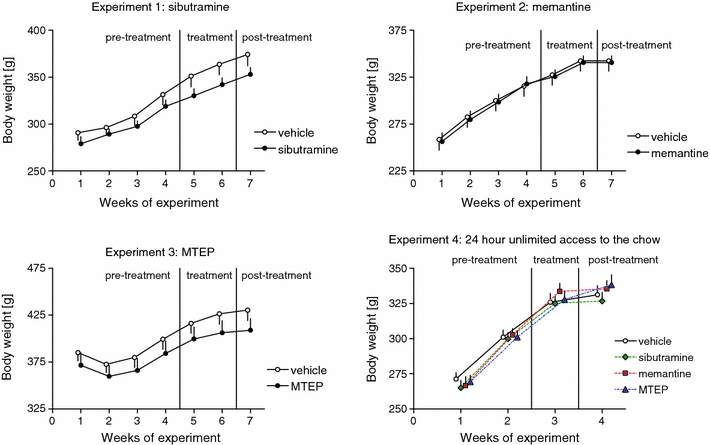
Body weight of all the groups tested. Panels show group means ± SEM. Panels 1–3 represents rats that were offered a limited access to the lard since the beginning of the experiment and were treated with respective medications during the treatment phase. Panel 4 represents rats that had continuous access to chow but no access to lard