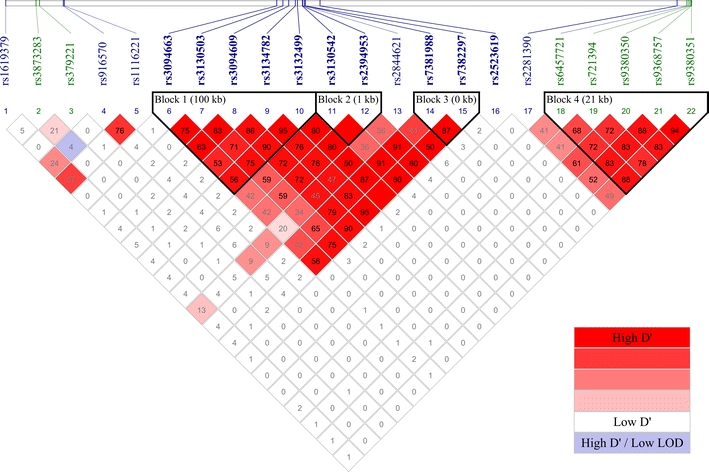
Fig. 4.

LD between the 22 replicated SNPs. The figure in each box gives the first two decimal places of the r 2 value. LD blocks identified by the confidence interval method were outlined. IDs in blue indicate SNPs that pass screening with WTCCC dataset, whereas IDs in green indicate SNPs that pass screening with T1DGC dataset. All SNPs showing novel associations are highlighted in bold (color figure online)
