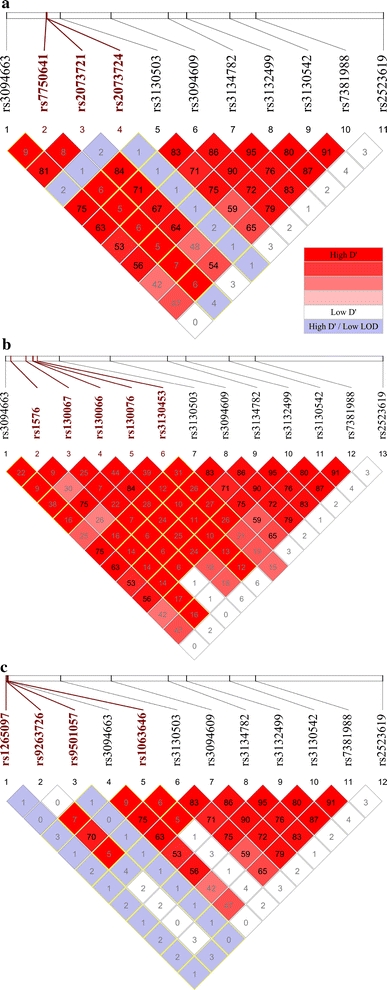
Fig. 6.

LD between the eight replicated SNPs with novel T1D associations and the missense SNPs within a TCF19, b CCHCR1 and c PSORS1C1. Only SNPs available in the CEU HapMap dataset were studied and any redundant SNPs were removed. All missense SNPs are highlighted in bold and red. Boxes of D′ = 1 are outlined in yellow (color figure online)
