Fig. 5.
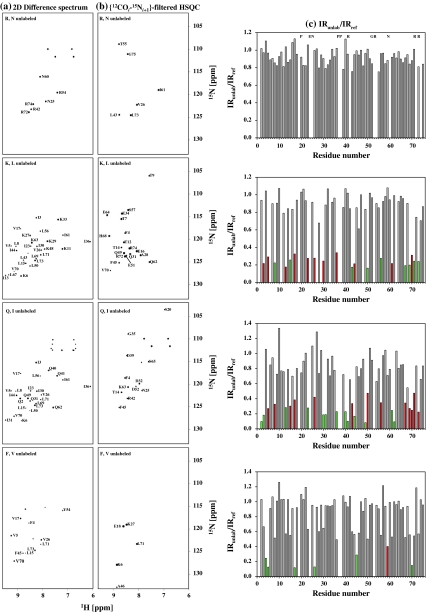
Experimental (a) 2D difference spectrum and (b) 2D {12COi–15Ni+1}-filtered HSQC spectrum for the different selectively unlabeled samples of Ubiquitin. The difference spectrum was obtained by appropriate scaling and subtraction of 2D [15N, 1H] HSQC spectrum acquired for the selectively unlabeled sample from that of the reference sample. Amino acid pairs selectively unlabeled in each sample are indicated in each spectra. The assignments of peaks are indicated by the single letter code followed by the residue number. c A plot of IRunlab,i/IRref,i: IRunlab,i = Iunlabi/Iunlabcontrol and IRref,i = Irefi/Irefcontrol where i denotes the residue number, I denotes volume of the peak and ‘control’ denotes a residue which does not undergo any effect of unlabeling in both selectively unlabeled and the reference sample. In this case the control residue chosen was G75. All residues that undergo the desired unlabeling are indicated as green bars and correspond to the pairs of amino acids indicated in the respective spectra in (a) and (b). Those residues which undergo unlabeling due to misincorporation of 14N are shown in red. In the case of (R, N) sample complete unlabeling of Arg and Asn was obtained (i.e., IRunlab,i/IRref ~ 0) and hence these residues are indicated in the top panel with the single letter code. E24 and G53 were not assigned and hence are absent along with Pro

