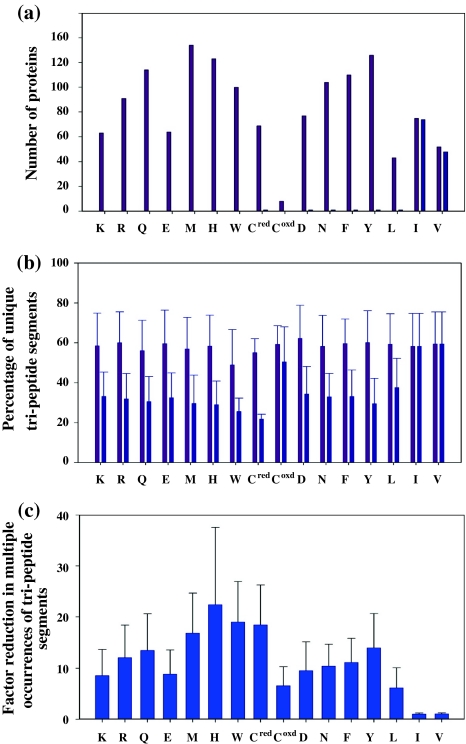
Fig. 9.
Statistical analysis of the uniqueness of tri-peptide segments in proteins rendered with selective unlabeling. The numbers/percentages corresponding to the selective unlabeling approach are shown in pink colour, whereas those corresponding to the non-selective method are indicated in blue. a The number of proteins in the database of 186 non-homologues proteins which have unique tri-peptide sequences containing a given amino acid residue in the central position. In such tri-peptide segments, the residue preceding and following the central residue is given a number code according to its amino acid type (Fig. 1) and the central residue is given a unique code (see Figure S3 of Supporting Information). The entire polypeptide chain (also converted to a sequence of codes) is then searched for multiple occurrences of such tri-peptide segments. b In proteins which had more than one occurrences of a given tri-peptide segment, the fraction of tri-peptide segments (expressed as percentage) that were unique using the criterion described in (a). c The ratio of number of tri-peptide segments that had multiple occurrences without the knowledge of the central amino acid residue as against multiple occurrences with selective identification

