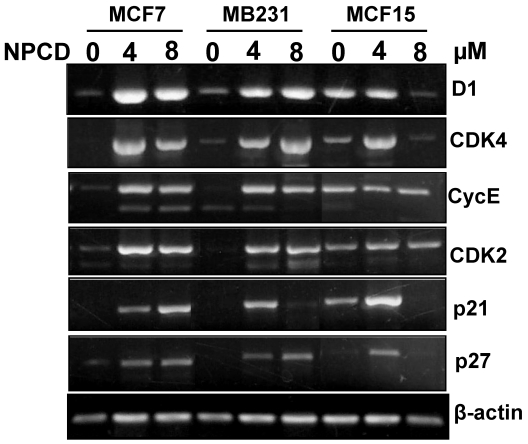
Fig 7.
RT-PCR detection of mRNA levels of different genes in MCF7, MB231 and MCF15 cells 72 hours after treatment with 4 or 8 µM NPCD or without the treatment. Note that the β-actin included as the loading control also shows a slight difference in some of the samples, which should be taken into account when a change in the expression of the desired gene is evaluated.

