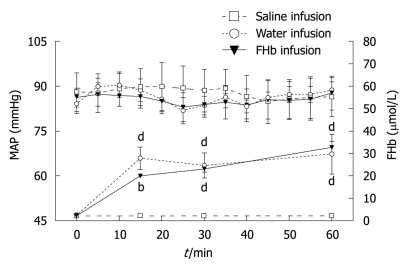
Figure 1.
The effect of saline, water or free oxyhemoglobin infusion on mean arterial pressure and free oxyhemoglobin levels. During the study period the mean arterial pressure (MAP) (left Y-axis) remained unchanged in all interventional groups. Plasma free oxyhemoglobin (FHb) levels (right Y-axis) were significantly elevated in the group with water infusion and in the group with FHb infusion after 15 min and onwards. bP < 0.01, dP < 0.001.

