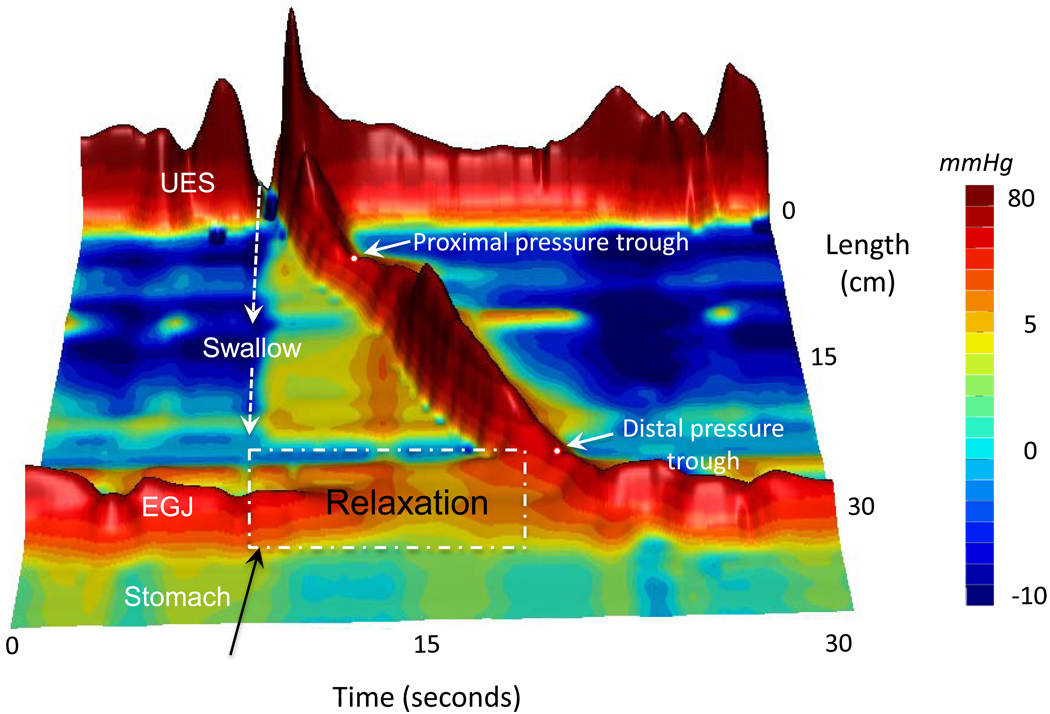
Figure 2. Landscape (3D) plots of HRM data are an alternative visualization technique that highlights regional pressure gradients and relationships.
This example illustrates the key landmarks of the normal swallow response and the normal architecture of the peristaltic contraction with two dominant pressure troughs isolating the proximal from distal esophagus and the distal esophagus from the LES.

