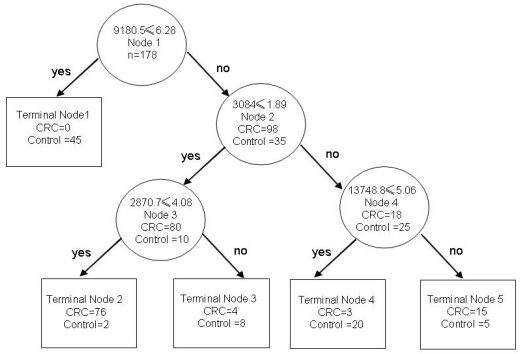
Figure 5.
The decision trees of diagnostic model for CRC. Each node was represented with different m/z value and the diagnosis result went left or right depending on the detected peaks in test sample. The sensitivity and specificity of diagnosis would significantly increase when several biomarkers were combined in use.

