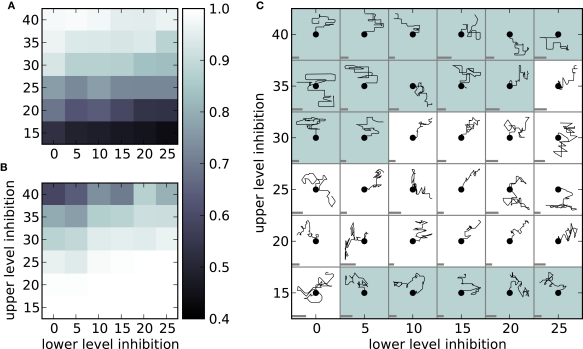
Figure 7.
Limits to simultaneity and sequentiality. (A) The simultaneity measure psim applied to 20 s of network activity as a function of the number of outgoing connections made by each inhibitory neuron on the lower (horizontal axis) and upper (vertical axis) levels. (B) As in (A) but for the sequentiality measure pseq. (C) Trajectories generated by 5 s of network activity. Each trajectory is initialized from the point marked with the dot by an initial stimulus to chains 1 and 2 to activate the direction “up.” Trajectories are scaled for visual clarity; to indicate the scaling, the gray bar in each cell shows the size of an arbitrary length unit. A white background color indicates that the network activity generating the trajectory meets both the criteria for simultaneity (0.5 < psim < 0.9) and sequentiality (pseq ≥ 0.9).

