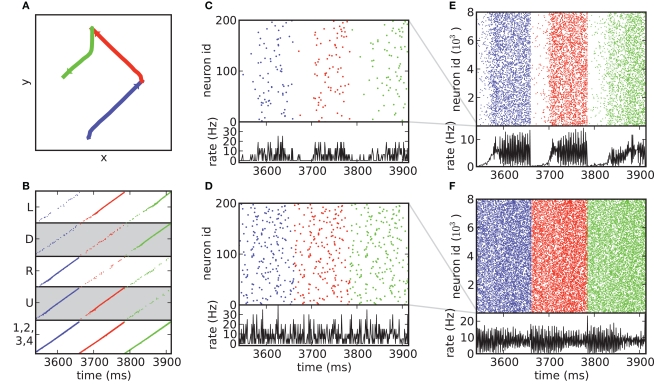
Figure 8.
Activity signatures during action execution. (A) Enlargement of the section of the trajectory marked in red in Figure 5B. The section contains three combinations of primitives. First, an “up/right” stroke (blue), then “up/left” (red), followed by a stroke which is initially “down” but turns into “left/down” midway through execution (green). Arrowheads mark the direction of stroke execution. (B) The underlying synfire chain activity. Each spike time marker is colored according to the drawing stroke in (A) that is being generated at that time. (C) Upper panel: shuffled spiking activity of 200 neurons from the upper level chains, spike time markers colored as in (B). Lower panel: histogram of spiking activity with a bin size of 1 ms and normalized by the number of neurons. (D) As in (C), but for the lower level chains. (E,F) As in (C,D), but for 8000 neurons. Gray lines indicate the range of neurons shown in (C) and (D).

