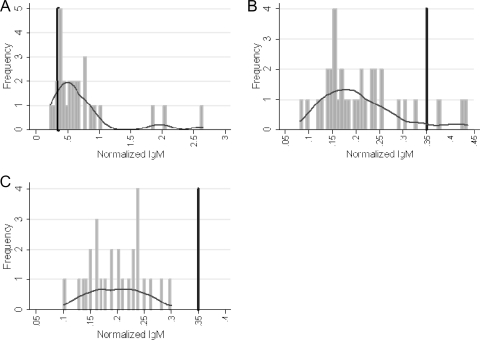
FIG. 1.
Frequency distribution of the IgM antibody titers against SSPA in the sample. Group A, individuals with prosthesis and staphylococcal infection (n = 29); group B, controls with prosthesis and no history of infection (n = 34); group C, controls with no prosthesis and no history of infection (n = 27). The vertical dark bars indicate an IgM antibody titer against SSPA of 0.35 EU (cutoff). The horizontal curves indicate Kernel density plots.

