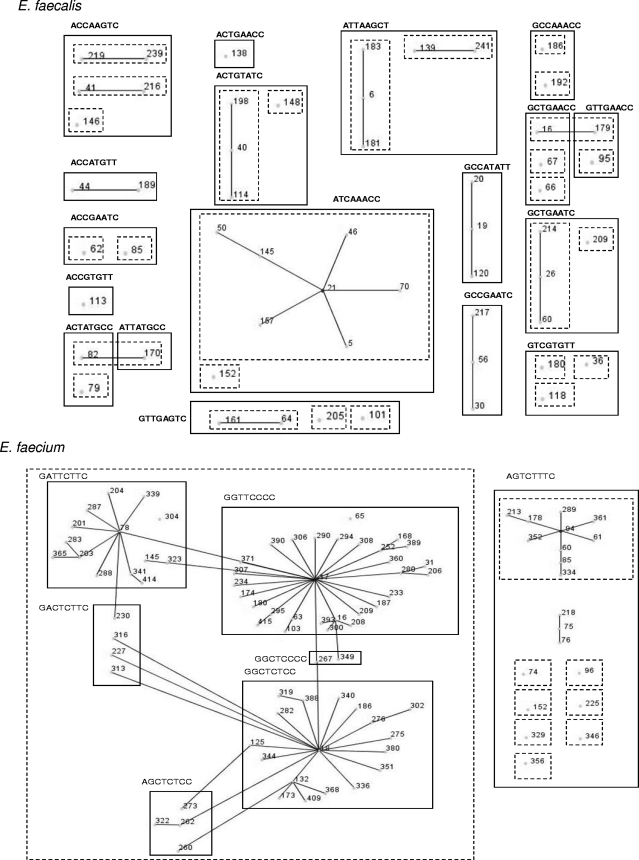
FIG. 1.
An eBURST population snapshot of 51 E. faecalis STs grouped into 18 SNP profiles and 27 E. faecium STs grouped into 7 SNP profiles. The dotted-line boxes represent clonal complexes as defined by the E. faecalis and E. faecium MLST databases; the solid-line boxes represent STs grouped according to their corresponding 8-nucleotide high-D-value SNP profiles. Single local variants are connected by solid lines.

