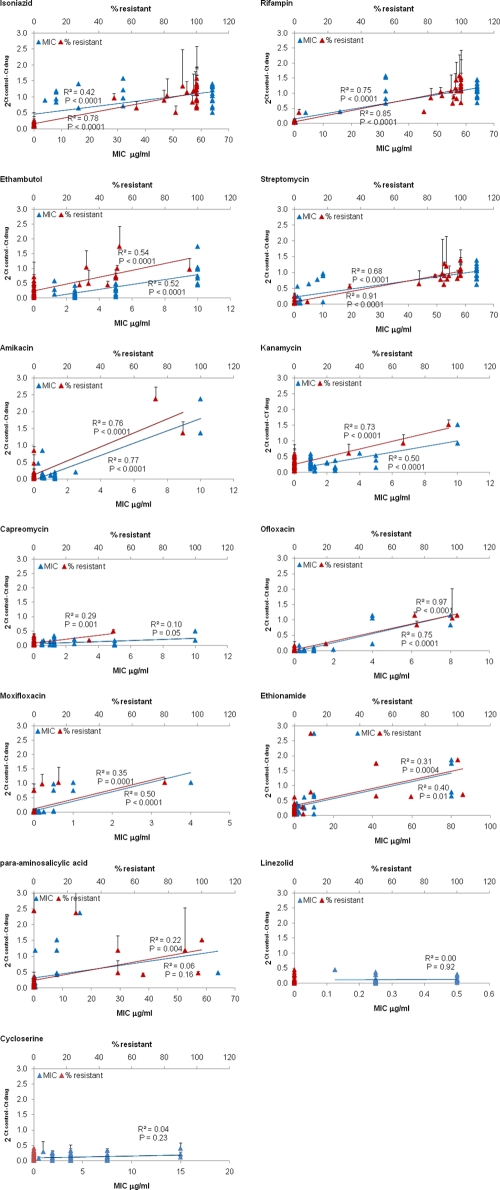
FIG. 3.
Correlation between PMA-qPCR (2ΔCT) and MIC or percentage of resistant colonies. Thirty-eight M. tuberculosis strains were tested by conventional agar proportion method critical concentration (where the percentages of resistant colonies were counted [upper x axis, red symbols]) and for MIC (lower x axis, blue symbols). All cultures were performed in duplicate, and therefore mean ± SD values are shown. The correlation of these values with 2ΔCT was tested for isoniazid, rifampin, ethambutol, streptomycin, amikacin, kanamycin, capreomycin, ofloxacin, moxifloxacin, ethionamide, para-aminosalicylic acid, linezolid, and cycloserine. Pyrazinamide MICs were not obtained. Best-fit lines and Pearson regression R2 values are shown.

