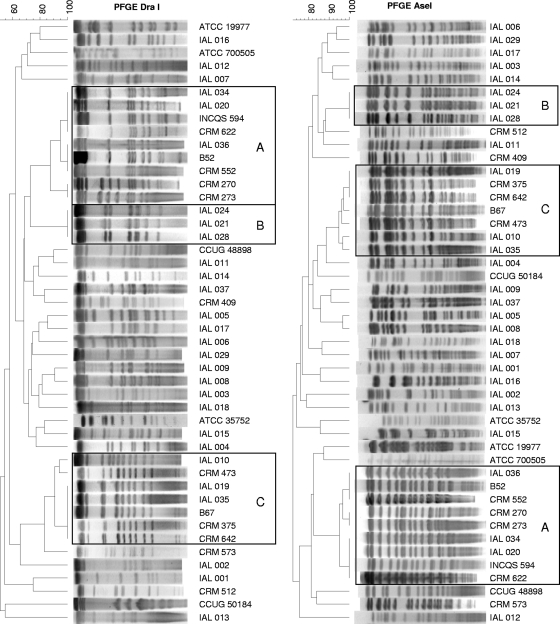
FIG. 2.
Dendrograms of DraI and AseI PFGE patterns of single isolates from 38 patients, M. abscessusT ATCC 19977, M. chelonaeT ATCC 35752, M. immunogenumT ATCC 700505, M. massilienseT CCUG 48898, M. bolletiiT CCUG 50184, and three previously studied isolates, INCQS 594, B52, and B67 (19, 28). Dendrograms were prepared using the BioNumerics (version 5.1) program by the Dice unweighted-pair group method with arithmetic means, based on 2% optimization and position tolerance. Isolates with highly similar (up to three band differences) PFGE patterns are boxed. Boxes A, isolates showing high degrees of similarity to surgical epidemic isolates; boxes B, indistinguishable patterns for isolates from three patients from different cities in SP; boxes C, isolates highly similar to a postinjection isolate from PA. Numbers at the upper left are percent similarity.

