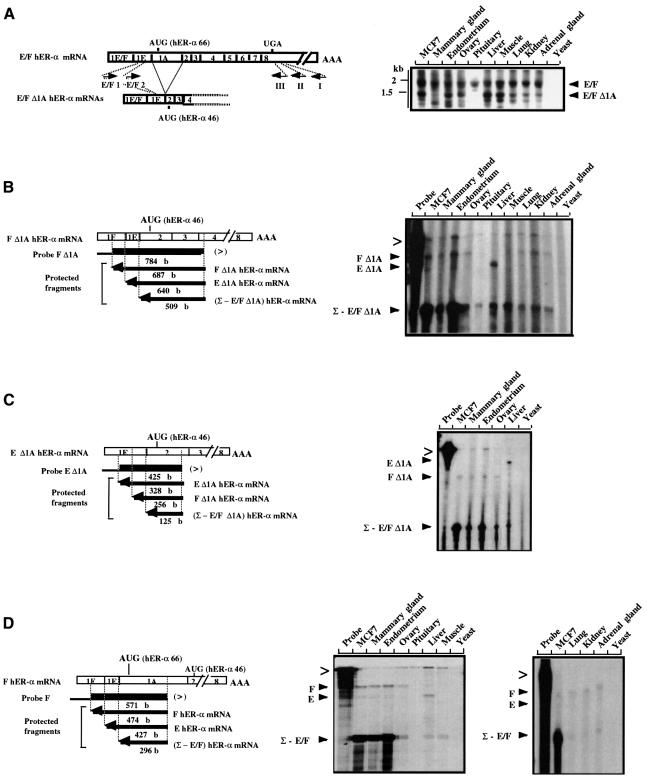
Fig. 3. E/F and E/F Δ1A hER-α mRNA variant distribution analysis. (A) RT–PCR analysis. Open boxes indicate the unique (1E or 1F) and common (part of 1E and 1A–8) exons encoding E/F hER-α mRNA isoforms. Approximate locations of primers are shown by short arrows. Primer I, located in the 3′ UTR of exon 8, was used to prime hER-α cDNA synthesis by reverse transcriptase, using total RNA from various sources as indicated at the top of each lane. Yeast total RNA was used as a negative control. Primer E/F1, which is specific for both E and F hER-α cDNA 5′ regions (in the common part of exon 1E), was then used in a first round of PCR amplification with primer II, which is nested to primer I in exon 8. A second round of PCR was performed with specific (E/F2) and common (III) nested primers. An oligonucleotide probe from exon 2 was used to confirm the specificity of the PCR products. Positions of migration of the molecular size markers are shown on the left side of the figure. (B–D) S1 nuclease mapping analysis. The S1 nuclease mapping assays of E/F and E/F Δ1A hER-α mRNA variants were performed as described in Materials and methods, with the single-stranded probes F (D), F Δ1A (B) and E Δ1A (C), and using 30 µg of total RNA from various sources as indicated at the top of each lane. Yeast total RNA was used as a negative control. The location and the size of each single-stranded probe (F, F Δ1A and E Δ1A) and each protected fragment obtained after S1 digestion of the probe/hER-α mRNA hybrids are indicated. Each probe was specific for one hER-α transcript (for example, F Δ1A hER mRNA) but was also able partially to protect the other hER-α mRNA isoforms [e.g. (Σ – E/F Δ1A) hER mRNA] up to the splice site positions. The probes were designed to contain vector sequence in their extremity (denoted by the thinner black line) in order to discriminate between undigested probes (>) and specific protected fragments.

An official website of the United States government
Here's how you know
Official websites use .gov
A
.gov website belongs to an official
government organization in the United States.
Secure .gov websites use HTTPS
A lock (
) or https:// means you've safely
connected to the .gov website. Share sensitive
information only on official, secure websites.
