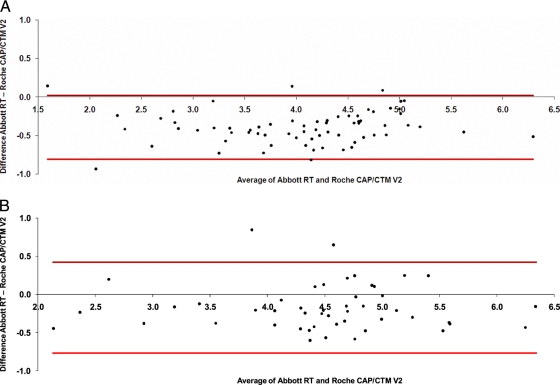
FIG. 1.
(A) Bland-Altman plot of Abbott RT versus Roche CAP/CTM-48 V2 assays of sample set 1 (log scale; horizontal lines represent approximate 95% confidence interval for individual differences). (B) Bland-Altman plot of Abbott RT and Roche CAP/CTM-48 V2 assays of HIV-1 group M and O samples (sample set 2) (log scale; horizontal lines represent approximate 95% confidence interval for individual differences).

