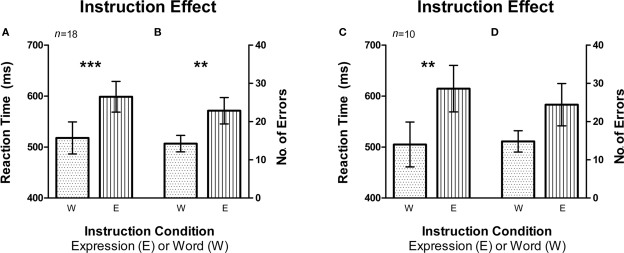
Figure 3.
Instruction effect depicting the automaticity of word reading compared to expression recognition. Error bars signify the standard error of mean (SEM). (A) Average reaction time (RT) was higher for the expression instruction condition compared to word instruction (n = 18, fMRI and Behavioral subjects). (B) There was also a larger average number of errors made on the expression instruction condition as compared to the word instruction condition (n = 18, fMRI and Behavioral subjects). (C,D) Same pattern was observed in RT and number of errors for fMRI subjects only (n = 10). **signifies p < 0.005, ***signifies p < 0.0005.

