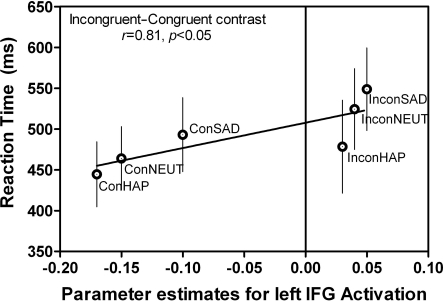
Figure 7.
Correlations between behavior and BOLD signal in left IFG. The same left IFG ROI (Figure 5F: −46, 36, 4) during the “Attend to Word” instruction, incongruent–congruent contrast showed a positive correlation between the RT and BOLD signal intensity. This indicates that additional resources in this region were recruited when the incongruent expressions were being reported. This graph is an average of all subjects’ RT and BOLD signal during each of the conditions (n = 10). Error bars signify the standard error of mean (SEM).

