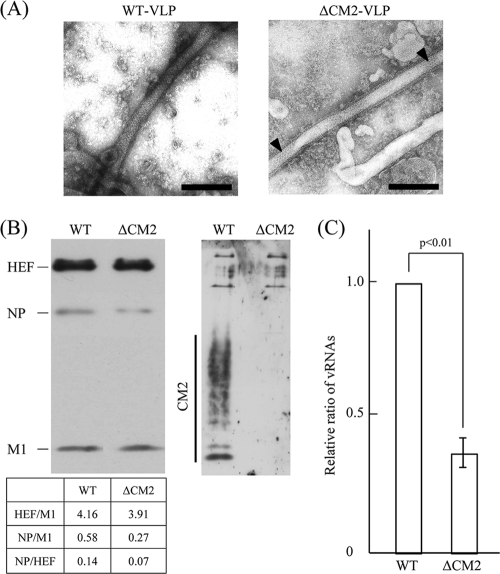
FIG. 1.
VLPs generated from 293T cells transfected with plasmid DNAs. VLPs generated from 293T cells transfected with the 10 (WT VLP) or nine (ΔCM2 VLP) plasmid DNAs were analyzed (see Materials and Methods for plasmid composition). (A) The supernatant of the 293T cells was negatively stained and observed using an electron microscope. Black triangles indicate hexagonal arrays of HEF (right panel). Bar, 200 nm. (B) Purified VLPs were lysed, electrophoresed by SDS-PAGE, and subjected to immunoblotting using a mixture of MAbs against HEF, NP, and M1 (left) and with antiserum against CM2 (right). Band intensities of HEF, NP, and M1 in the respective lanes were measured, and the ratios of HEF/M1, NP/M1, and NP/HEF are shown. (C) RNA was extracted from the purified VLPs, treated with DNase, reverse transcribed, and then subjected to real-time PCR for quantification of GFP-vRNA. Because the initial data were not normally distributed, they were log transformed for statistical analysis. The copy number of the GFP-vRNA in the WT VLPs was used for normalization. Each bar represents the mean ± standard errors of the means.

