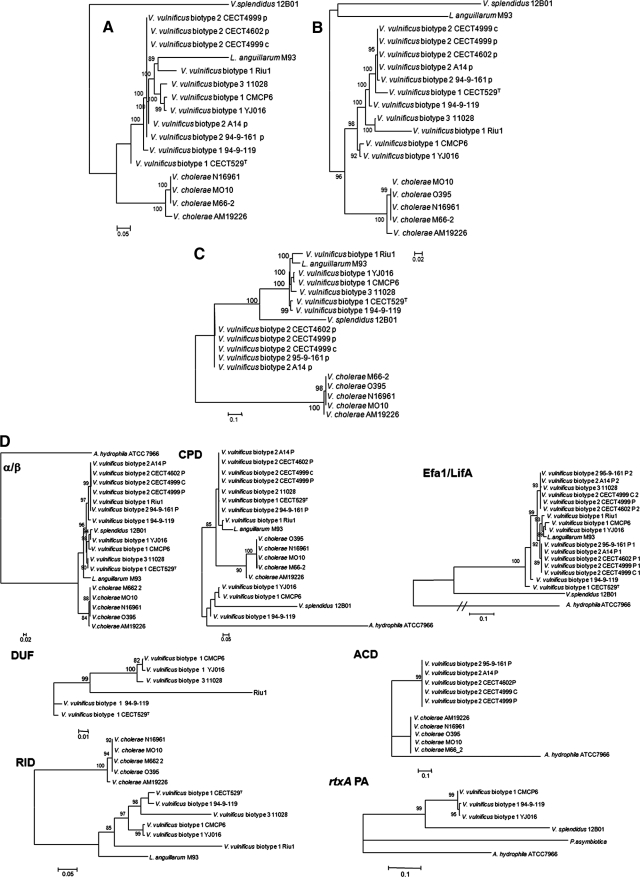
FIG. 3.
Maximum-likelihood trees derived from 5′-terminal (A), 3′-terminal (B), and internal (C) regions of the rtxA1 gene using the GTR+G model of evolution. The numbers of nucleotide positions considered in the multiple alignments were 5,844, 3,039, and 7,988, respectively. Bootstrap support values higher than 80% are indicated in the corresponding nodes. (D) Maximum-likelihood tree derived from the different modules of the rtxA1 gene using the GTR+G model of evolution. Bootstrap support values higher than 80% are indicated in the corresponding nodes.

