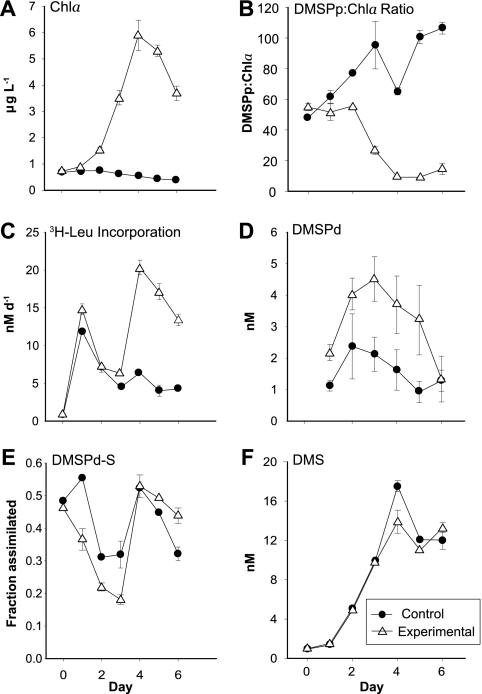
FIG. 1.
Biological and chemical properties of control and experimental microcosms during the 6-day study. Panels show concentrations of chlorophyll a (A), the ratio of particulate DMSP concentration to chlorophyll a concentration (B), rates of heterotrophic bacterial protein production (C), the concentration of dissolved DMSP (D), the fraction of the dissolved DMSP consumed by bacteria that was assimilated into macromolecules (E), and the concentration of DMS (F). Each point represents the mean and standard deviation of three independent determinations from two replicate microcosms.

