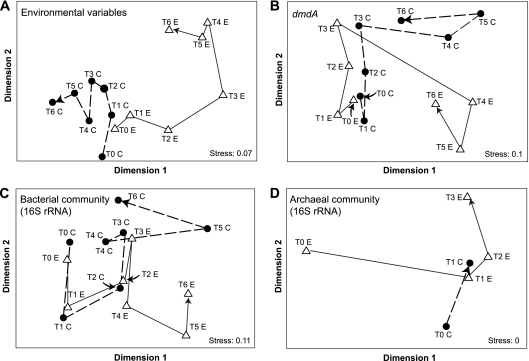
FIG. 2.
Multidimensional scaling of the Bray-Curtis similarity matrix generated from measures of environmental variables (principal-component analysis) (A), the relative abundance of the 100 largest dmdA clusters (B), the relative abundance of bacterial 16S rRNA gene clusters (C), and the relative abundance of archaeal 16S rRNA gene clusters (D) over time in control and experimental microcosms. Arrows show the time progression for control “C” (closed circles) and experimental “E” (open triangles) microcosms.

