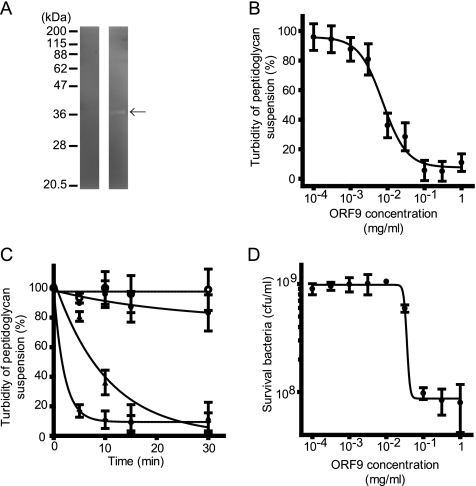
FIG. 2.
Lytic activity of ORF9 against E. faecalis peptidoglycan and cells. (A) Zymography of ORF9-His-overexpressing E. coli. In the left and right lanes, E. coli BL21(pColdIII ORF9-His) without and with IPTG induction, respectively, is shown. Only E. coli BL21(pColdIII ORF9-His) with IPTG induction (right lane) showed a clear band, which was detected at the expected molecular size (arrow). (B) Dose-response curve of ORF9-His against E. faecalis peptidoglycan, summarizing the data at 10 min after the turbidity assay. Concentration-dependent ORF9 effects were observed. (C) Time course assay of ORF9-His treatment against E. faecalis peptidoglycan. Various concentrations of ORF9-His were treated with E. faecalis peptidoglycan; limited concentrations of ORF9-His treatment are presented. The ORF9-His concentrations at 0 (○), 10−4 (•), 10−2 (▴), and 1 (⧫) mg/ml are shown. The turbidity decreased time dependently. (D) Dose-response bactericidal effect of ORF9 against E. faecalis cells. Three hours after ORF9 treatment of E. faecalis cells, the viable count was measured. The error bars indicate the SD.

