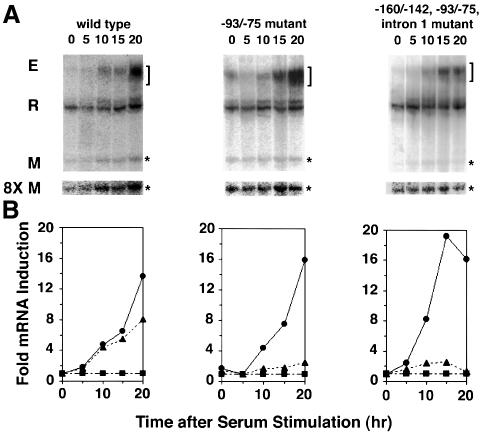
Fig. 3. Mutation of LSF binding sites inhibits G1–S stimulation of TS minigene mRNA levels. (A) Representative S1 analysis of mRNA from endogenous TS and TS minigenes. NIH 3T6 cells were stably transfected with the indicated minigene, and equal amounts of mRNA were analyzed by S1 nuclease protection assays. The number above each lane indicates the time after serum stimulation (in hours) at which mRNA was collected. The R band represents ribosomal protein L32 mRNA and serves as the internal control. The bracket marks the endogenous (E) TS products, which appear as a broad smear due to the protection of the S1 probe into the region of multiple start sites in the TS promoter (Geng and Johnson, 1993). The asterisks mark the minigene (M) products. For visualization purposes, the sections of the autoradiographs containing the TS minigene products were enhanced 8-fold (8× M) and displayed beneath the full-length autoradiographs. (B) Quantitation of the levels of minigene and endogenous TS mRNAs shown in (A). To correct for differences in RNA recovery, TS mRNA levels (E and M) were normalized to those of the control (R). The indicated fold increases were calculated by normalizing to the lowest mRNA levels. Circles represent endogenous TS mRNA levels, triangles represent TS minigene mRNA levels, and squares represent control ribosomal protein L32 mRNA levels.

An official website of the United States government
Here's how you know
Official websites use .gov
A
.gov website belongs to an official
government organization in the United States.
Secure .gov websites use HTTPS
A lock (
) or https:// means you've safely
connected to the .gov website. Share sensitive
information only on official, secure websites.
