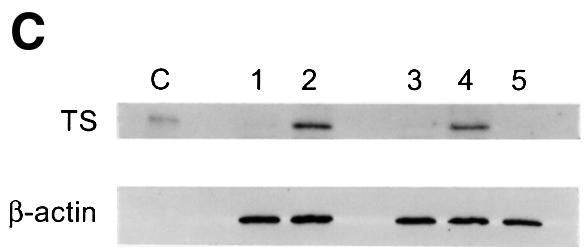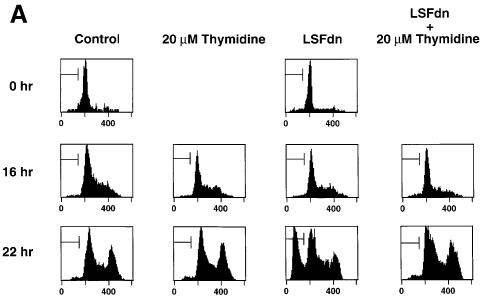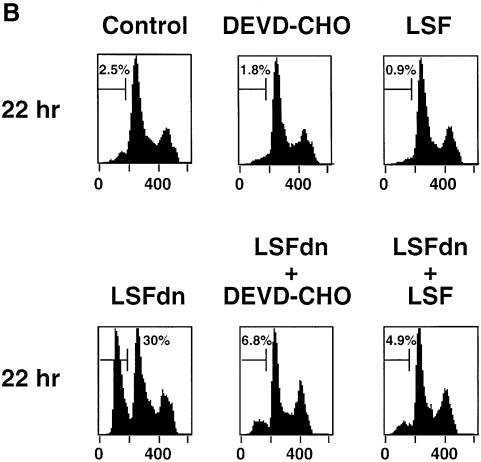
Fig. 4. LSFdn induces apoptosis, which is reversible by thymidine. (A) Flow cytometric analysis of the DNA content in transiently transfected NIH 3T3 cells either expressing LSFdn or not. Cells were transfected and growth arrested, as described in Materials and methods, with 2.5 µg of pMARK7 DNA and 12.5 µg of either pEF-1α or pEF-1α-LSFdn DNA. Cells were subsequently propagated in the absence or presence of 20 µM thymidine, which was added at the time of serum stimulation. The histograms represent relative measurements of DNA content in cells expressing exogenous CD7. The bracket indicates cells that contain less than the G1 DNA content, characteristic of apoptosis. Numbers on the left indicate the time (h) after serum stimulation. The number of cells represented in each histogram, left to right, is as follows. Top row: 623, 1023; middle row: 3618, 2419, 2447, 2201; bottom row: 7417, 13434, 6725, 6701. (B) DNA fragmentation in NIH 3T3 cells transfected by LSFdn is inhibited by a peptide caspase inhibitor and by coexpression of LSF. pEF-1α-LSF (or pEF-1α, in control samples) was cotransfected at a 3:1 ratio with pEF-1α-LSFdn (9.4 µg of pEF-1α-LSF DNA, 3.1 µg of either pEF-1α or pEF-1α-LSFdn DNA, and 2.5 µg pMARK7 DNA), as indicated. CD7-positive cells were analyzed 22 h after serum stimulation. The number of cells represented in each histogram, left to right, is as follows: 13347, 5112, 14500, 19124, 10232, 7572. The numbers above the brackets indicate the percentage of cells with a less than G1 cellular DNA content. (C) Induction of TS protein is reduced in cells transfected with LSFdn, even in the presence of the caspase (CPP32) peptide inhibitor, DEVD-CHO. Cytoplasmic extracts were prepared from CD7-positive cells, sorted by flow cytometry and analyzed by western blotting for TS. The blot was subsequently stripped and re-probed with an antibody against β-actin, as indicated. Lane C contains wild-type mouse recombinant TS (Zhang et al., 1989) used as a size marker. Lane 1, 5 µg of cytoplasmic extract from quiescent NIH 3T3 cells (starved 36 h); lane 2, 5 µg of extract from NIH 3T3 cells undergoing logarithmic growth; lane 3, 5 µg of extract from CD7-positive NIH 3T3 cells 22 h post-stimulation with pEF-1α-LSFdn; lane 4, 5 µg of extract from CD7-positive cells 22 h post-stimulation with pEF-1α; lane 5, identical to lane 3 with the exception that the cells were incubated with 2.0 µM DEVD-CHO from the time of serum stimulation.


