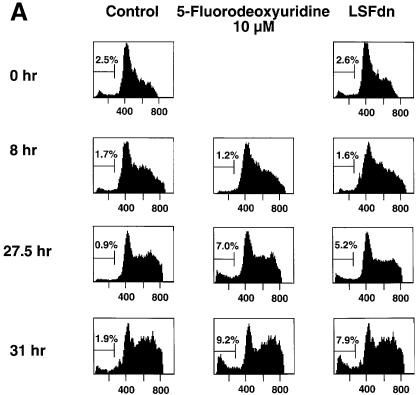
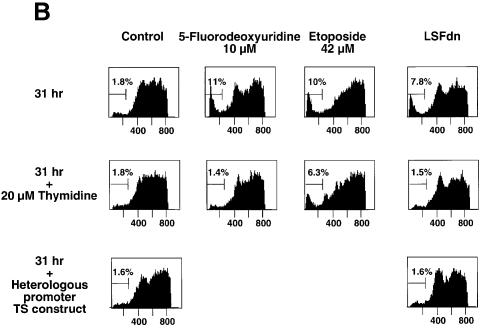
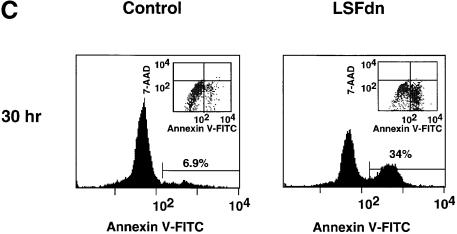
Fig. 5. LSFdn induces apoptosis in human prostate cancer cells by a mechanism dependent on thymidine metabolism. (A) Apoptosis induced by LSFdn in human prostate cancer DU145 cells mimics apoptosis induced by 5-fluorodeoxyuridine. Flow cytometric analysis of the DNA content in transiently transfected DU145 cells at 0, 8, 27.5 and 31 h after serum stimulation. The experiment was conducted as in Figure 4A. Cells were propagated in the absence or presence of 10 µM 5-fluorodeoxyuridine as indicated, added at the time of serum stimulation. The brackets indicate a less than G1 cellular DNA content, characteristic of apoptosis. The numbers above the brackets indicate the percentage of cells fluorescing in this range. The number of cells represented in each histogram, left to right, is as follows. 0 h: 8767, 8819; 8 h: 10614, 15867, 17429; 27.5 h: 19634, 23496, 22584; 31 h: 6598, 12909, 7181. (B) Apoptosis induced by LSFdn in human prostate cancer cells is prevented by the presence of 20 µM thymidine or by the expression of TS driven by a heterologous promoter. The experiment was conducted as in (A), with the DNA content of transiently transfected DU145 cells analyzed by flow cytometry 31 h after serum stimulation. Enzyme inhibitors and thymidine were added at the time of serum stimulation in the indicated concentrations. Where indicated, the TS gene driven by a heterologous promoter was cotransfected with either pEF-1α-LSFdn or pEF-1α DNA (specifically, 2.5 µg of pMARK7 DNA, 9.4 µg of pSTI56T DNA and 3.1 µg of pEF-1α or pEF-1α-LSFdn DNA). The brackets indicate a less than G1 cellular DNA content, characteristic of apoptosis. The numbers above the brackets indicate the percentage of cells that contain less than the G1 DNA content. The number of cells represented in each histogram, left to right, is as follows. Top row: 10729, 10201, 10409, 10822; middle row: 10171, 10737, 10414, 10396; bottom row: 10612, 10629. (C) LSFdn induces apoptosis in human prostate cancer cells as shown by annexin V–FITC binding. The number of cells represented in each histogram and corresponding dot-plot, left to right, is as follows: 11062, 10140. Cells were transfected and growth arrested, as described in Materials and methods, with 2.5 µg of pMARK7 DNA and 12.5 µg of either pEF-1α or pEF-1α-LSFdn DNA. Cells were incubated with annexin V–FITC in a buffer containing 7-AAD and analyzed by flow cytometry. The brackets show levels of fluorescence indicative of annexin V–FITC binding. Many cells transfected with LSFdn were either undergoing apoptosis (annexin V–FITC positive, 7-AAD negative) or had died as a result of apoptosis (annexin V–FITC positive, 7-AAD positive).

An official website of the United States government
Here's how you know
Official websites use .gov
A
.gov website belongs to an official
government organization in the United States.
Secure .gov websites use HTTPS
A lock (
) or https:// means you've safely
connected to the .gov website. Share sensitive
information only on official, secure websites.


