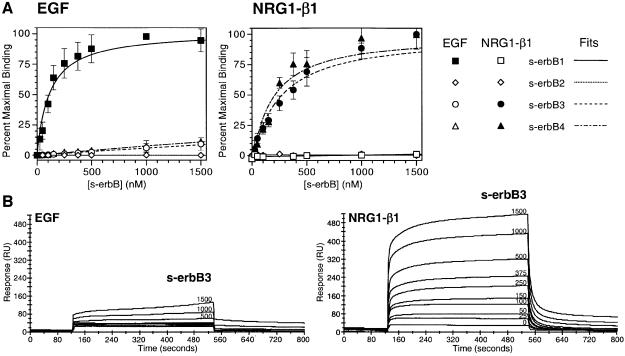
Fig. 2. (A) Data for binding of s-erbB1, s-erbB2, s-erbB3 and s-erbB4 to EGF (left) and NRG1-β1 (right), immobilized on a BIAcore sensor chip. Best fits to the data, assuming a simple association model, are shown. Errors are standard deviations from the mean of at least four independent determinations at each point. KD values represented by the best fits are listed in Table I. (B) Representative raw BIAcore data for s-erbB3 flowed in parallel over a biosensor chip derivatized with EGF (left) and NRG1-β1 (right) at a series of different concentrations (marked on each curve in nM).

An official website of the United States government
Here's how you know
Official websites use .gov
A
.gov website belongs to an official
government organization in the United States.
Secure .gov websites use HTTPS
A lock (
) or https:// means you've safely
connected to the .gov website. Share sensitive
information only on official, secure websites.
