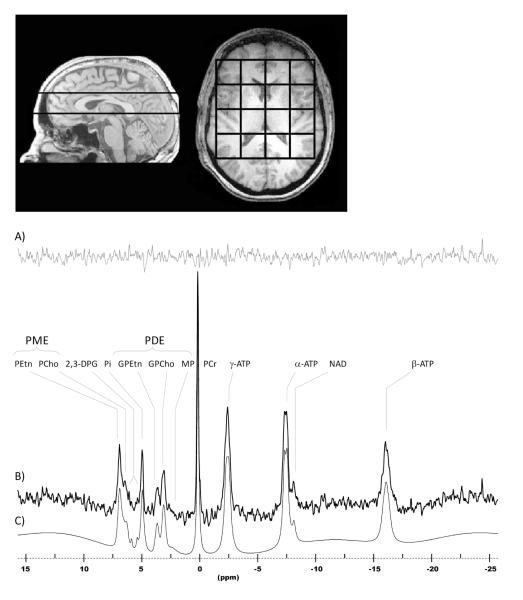
Fig.1.
Magnetic resonance images depicting 3 cm chemical shift imaging slab placement and grid alignment and an in vivo human brain sample phosphorus spectrum acquired from a single voxel at 4.0 Tesla. Spectrum (B) is displayed with 5 Hz exponential filtering for display, as well as residual (A), and fitted curve (C). The main metabolites are clearly visible, including the phosphomonoesters (PME) and the phosphodiesters (PDE). PEtn = phosphoethanolamine; PCho = phosphocholine; Pi = inorganic phosphate; GPEtn = glycerophosphoethanolamine; GPCho = glycerophosphocholine; MP = membrane phospholipid; PCr = phosphocreatine; ATP = adenosine triphosphate; NAD = nicotinamide adenine dinucleotide.

