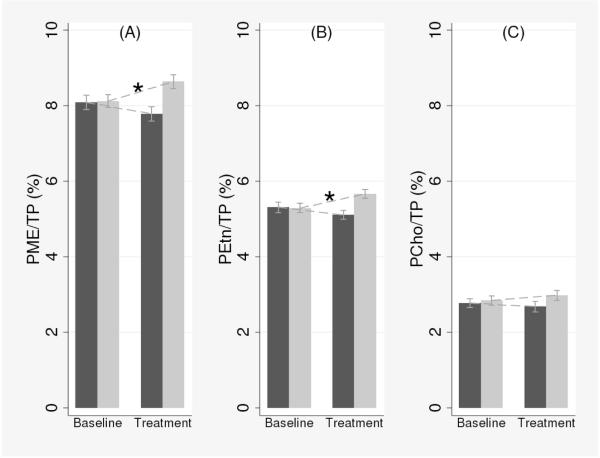
Fig. 3.
Changes in metabolite levels at baseline and following one week of uridine intake in (A) total PME, (B) PEtn, and (C) PCho. The black bars represent the placebo group and the white bars represent the uridine group. Vertical bars denote 95% confidence intervals. Each mean value (y-axis) represents percentage of metabolite levels over total phosphorus. TP = total 31P; PME = phosphomonoesters; PEtn = phosphoethanolamine; PCho = phosphocholine. *p < 0.001.

