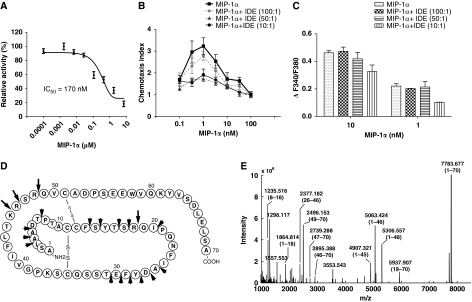
Figure 6.
Functional analyses on the effect of MIP-1 degradation by IDE. (A) Inhibition of IDE-mediated degradation of substrate V by MIP-1α. IDE activity on substrate V was measured at 37°C in the presence of indicated concentrations of MIP-1α. (B, C) Effects of IDE on the chemotaxis and increase of [Ca2+]i of MIP-1α on THP-1 Cells. MIP-1α was preincubated with IDE at the indicated molar ratio at 37°C for 15 min. For the chemotactic activity (B), chemotactic response was expressed as mean chemotaxis index. For the MIP-1-mediated increase of [Ca2+]i (C), fura-2 loaded THP-1 cells were stimulated with either 1 or 10 nM MIP-1α as the positive control or the same concentrations of MIP-1α that were pretreated with IDE (MIP-1α+IDE). MIP-1α-dependent increases of [Ca2+]i were monitored by ratio of fluorescence at 340 over 380 nm. The change of [Ca2+]i is indicated by ΔF340/F380, which is the difference between the peak F340/F380 value after addition of MIP-1α and the basal level before stimulation. (D) Summary of IDE cleavage sites on the MIP-1α primary sequence by mass spectrometry analysis is illustrated. Initial cleavage sites and secondary cutting sites are shown as big and small arrows, respectively. (E) Representative ESI-FTICR-MS spectrum of MIP-1α after a 2-min IDE digestion.

