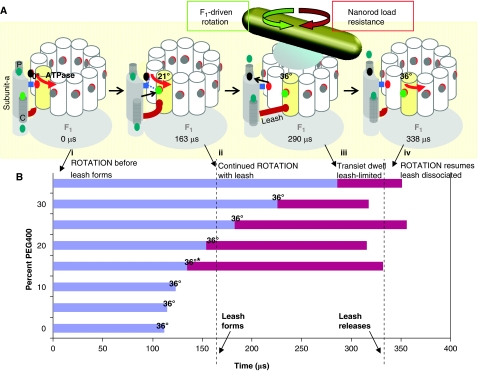
Figure 9.
Timing of formation and release of the leash interaction relative to c-ring rotation. (A) Model of leash interaction between subunits a and c at 35% PEG400. Green dots: H+ in subunit-a cytoplasmic (C) and periplasmic (P) half-channels. Grey/black dots: H+ on cD61 (red dots). Periplasmic half-channel in subunit-a (P). (i) Rotation without leash; (ii) Leash forms, but rotation continues; (iii) Rotation at end of leash; (iv) Leash dissociates, rotation resumes. (B) Time course of c-ring rotation and transient dwell duration as a function of PEG400 concentration. Blue bars indicate average time for the c-ring to rotate 36°. At 15% PEG400, the subpopulation of molecules that gave rise to the transient dwells rotated more slowly (36°*) than the average rotational velocity (Figure 8B). Red bars indicate average transient dwell duration.

