Figure 6.
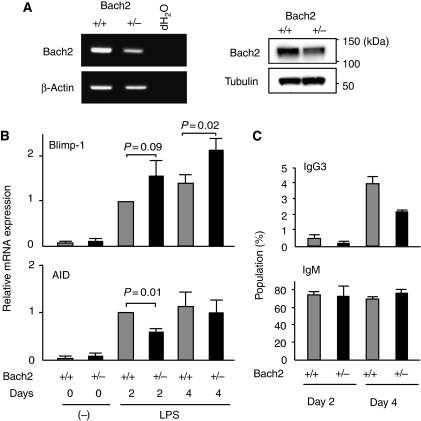
The quantity of Bach2 influences activated B-cell fate. (A) Expression of Bach2 mRNA (left panels) or protein (right panels) in splenic B cells was analysed by RT–PCR or western blot analysis, respectively. β-Actin and tubulin are shown as loading control. (B) Blimp-1 and AID mRNA expression was analysed by quantitative RT–PCR at 2 or 4 days in LPS-stimulated splenic B cells from wild-type (grey columns) or Bach2+/− (black columns) mice. β-Actin expression was used as the normalization control. Mean data from three independent cultures and s.e. are shown. (C) Splenic B cells from mice of wild-type (grey columns) or Bach2+/− (black columns) were induced to undergo isotype switching to IgG3 in culture by stimulation with LPS. Surface expression of IgG3 on cultured B cells was analysed by FACS at indicated days. Average percentages from three independent experiment and ±s.e. are shown.

