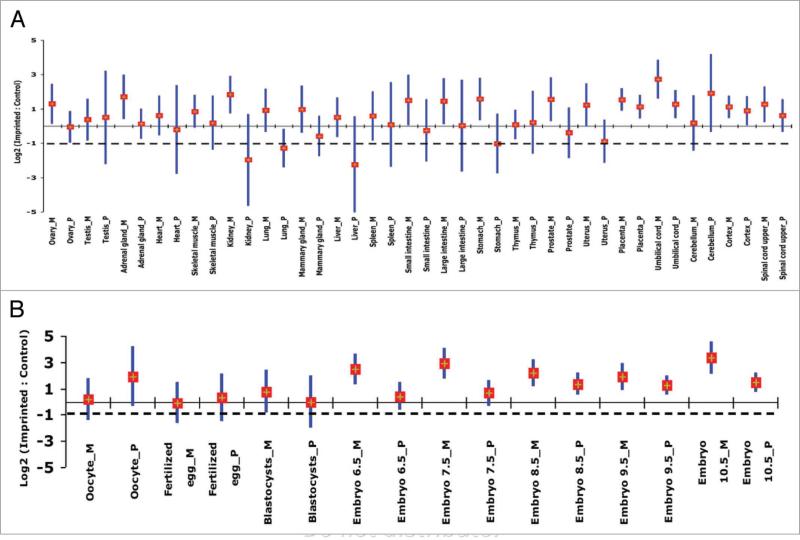
Figure 4.
Upregulation of maternally-(M) and paternally-expressed (P) genes in adult and embryonic mouse tissues based on microarray results. Each vertical bar represents the confidence interval (95%) of imprinted/control ratios; a diamond marks the mean for the indicated tissue. Gene expression levels are on the log2 scale. The solid and broken lines show the expected values for two-fold upregulation and for no upregulation, respectively. (A) Adult (10–12 weeks old) mouse tissues and two extraembryonic tissues. (B) Embryonic tissues at specific developmental stages. Although not significantly different, a trend in parent-of-origin effect in expression of imprinted genes is clear. A relative expression of maternally-expressed genes was higher in various adult tissues and in embryos of various ages except in the cerebellum in adults.

