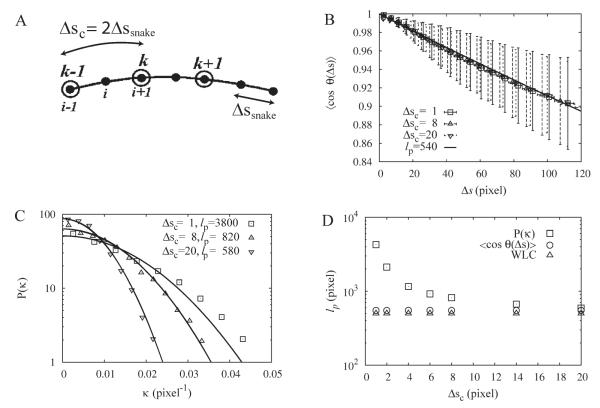
Fig. 7. Coarse graining analysis of curvature reveals the true rigidity of WLCs.
The calculations use WLCs with lp = 500 pixels (n = 40 filaments). A: Schematic of coarse graining. The black dots represent the sampling points of the active contour that are separated by Δssnake. Without coarse-graining, the coordinates of i − 1,i, and i + 1 are used to calculate the tangent vectors and curvature. With coarse-graining, Δsc = 2 in this example, sites k − 1,k, and k + 1 are used instead. B: The tangent correlations are weakly dependent on coarse graining length Δsc and follow single exponential decay (solid line). Error bars indicate standard deviation of individual measurements. C: Plot of curvature distributions for different coarse-graining lengths Δsc. The widths depend on Δsc, as expected from Equation (21). In addition to this change, the value of the extracted persistence lengths (shown in the panel) change with Δsc as well. D: Measured persistence lengths as a function of Δsc calculated from the tangent correlation (circles) and curvature distribution (squares) as compared to the intrinsic persistence length of WLCs (triangles). The accuracy of estimates of persistence length using the curvature distribution increases with increasing Δsc.

