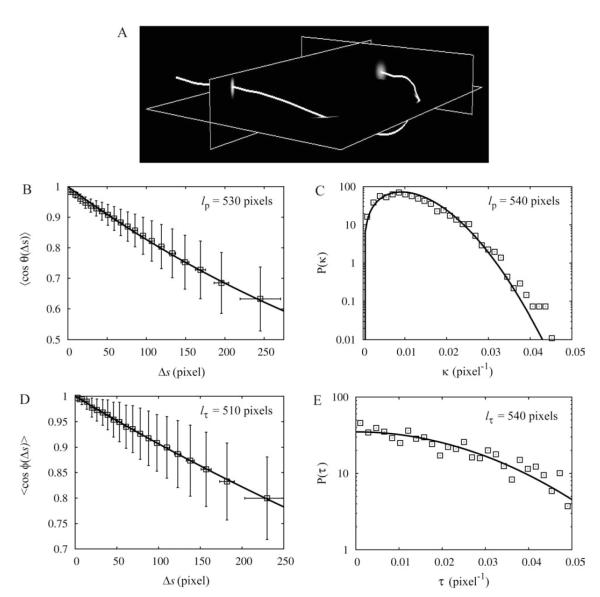
Fig. 8. Analysis of simulated images of 3D filaments with known bending and torsional persistence lengths (lp = lτ = 500 pixels) demonstrates the validity of SOACs.
Measured values from fits are shown in the panels. In all cases, these values are within 10% of the intrinsic values (see also Table II). Coarse-graining length is Δsc = 20 pixels and n = 40 filaments. Error bars indicate standard deviation of individual measurements. A: Typical simulated 3D image. B: The tangent correlation function and exponential fit. C: Curvature distribution and fit to Eq. 22. D: Binormal correlation and exponential fit. E: Torsion distribution and Gaussian fit.

