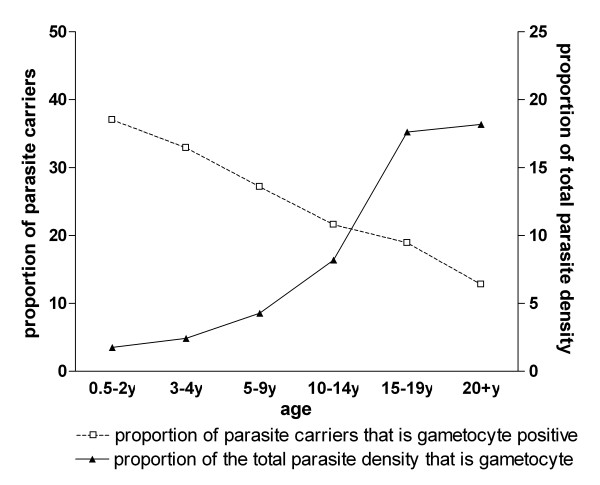
Figure 2.
The prevalence and density of gametocytes relative to total parasite carriage by microscopy. The number of asexual parasite carriers (with gametocytes) for the different age groups was 0.5-2y: 297 (127); 3-4y: 468 (171); 5-9y: 1053(326); 10-14y: 690(174); 15-19y: 254(72); 20+y: 285(114). Note: data for those carrying gametocytes in the absence of asexual parasitaemia were excluded (see Figure 3).

