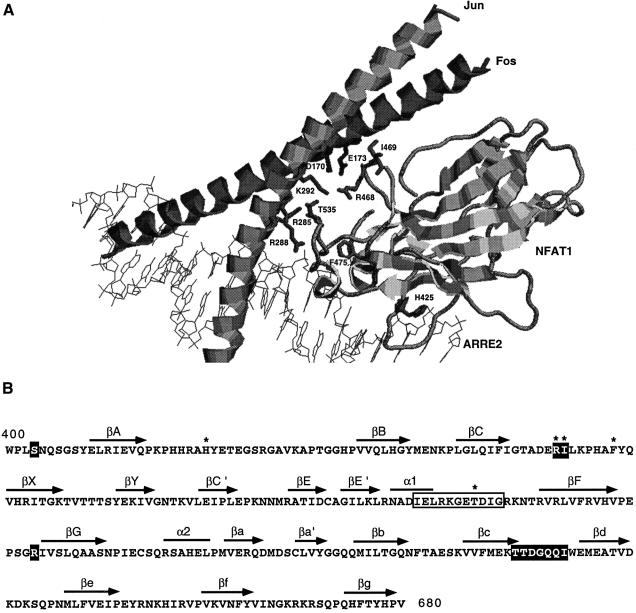
Fig. 1. Residues involved in NFAT1–Fos–Jun interaction. (A) Close-up view of the NFAT1–Fos–Jun–DNA complex (Chen et al., 1998). Ribbon diagram made using Rasmol. Side chains of NFAT1 involved in NFAT1–Fos, NFAT1–Jun and NFAT1–DNA interactions that were mutated in this study are shown. (B) Amino acid sequence and secondary structure of the NFAT1 DBD. Residues that contact Fos are shown in open boxes while residues involved in Jun contacts are shown in white inside black boxes. The residues mutated in this study are indicated by asterisks.

An official website of the United States government
Here's how you know
Official websites use .gov
A
.gov website belongs to an official
government organization in the United States.
Secure .gov websites use HTTPS
A lock (
) or https:// means you've safely
connected to the .gov website. Share sensitive
information only on official, secure websites.
