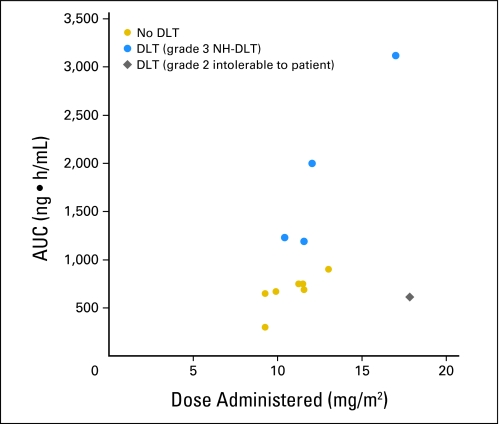
Fig 2.
Systemic exposure determined by area under the plasma concentration-time curve extrapolated to infinity (AUC0-∞) is proportional to the actual administered dose (mg/m2). Cediranib exposure increased in proportion to dose. Patients with dose-limiting grade 3 nonhematologic toxicity (NH-DLT) seem to have higher AUC than the patient who experienced grade 2 fatigue that was intolerable and dose limiting or patients with no DLT.

