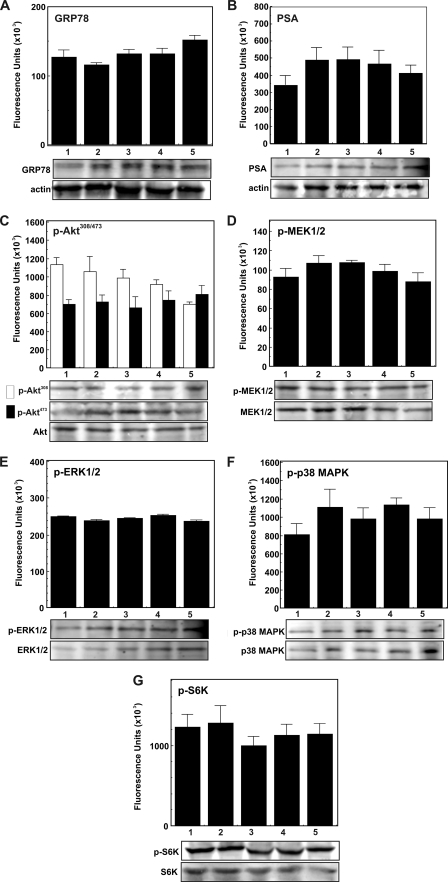
FIGURE 8.
Effect of α2M·PSA on levels of PSA, GRP78, phospho-MEK1/2, phospho-ERK1/2, phospho-p38 MAPK, phospho-AktThr-308, phospho-AktSer-473, and phospho-S6K in PC-3 cancer cells. A–G, treatments of cells in each panel are as follows: buffer (lane 1), native α2M (50 pm for 20 min) (lane 2), α2M·methylamine (50 pm for 20 min) (lane 3), premade α2M·PSA (50 pm for 20 min) (lane 4), and α2M·PSA made in culture (5 μg/ml for 20 min (lane 5). □, phospho-AktThr-308; ■, phospho-AktSer-473. Changes in each immunoblot are shown in fluorescence units (× 103) as determined by a PhosphorImager and are expressed as the mean ± S.E. from three independent experiments assayed in triplicate in the bar diagram above the respective immunoblot. The protein loading controls (unphosphorylated protein or actin) are shown below the respective immunoblot.

